Ichimoku Cloud Trading: The Ultimate Trend Indicator
Ichimoku Cloud Trading: The Ultimate Trend Indicator
In a world of complex technical analysis, the Ichimoku Kinko Hyo (often called just "Ichimoku Cloud") stands out. Developed by Goichi Hosoda, a Japanese journalist, in the late 1930s (and published in 1969), its name roughly translates to "One Glance Equilibrium Chart."
The promise is bold: nearly all information you need to make a trading decision—trend direction, momentum, support, and resistance—can be gathered in a single glance.
This guide explores the five components of the system and how to synthesize them into powerful trading strategies.
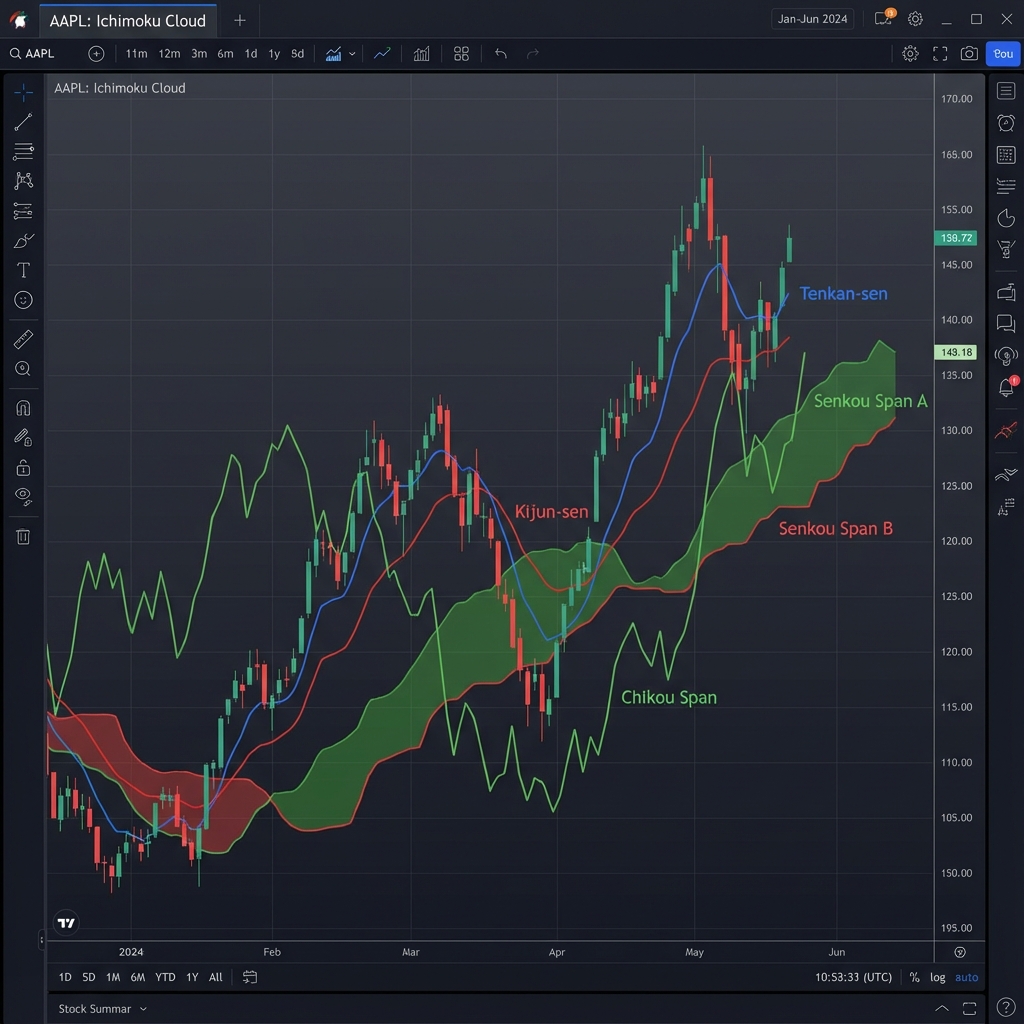
1. The Five Components of Ichimoku
Unlike Western moving averages which use closing prices, Ichimoku uses the midpoint of the high and low over a specific period. This captures the equilibrium of the price action.
1. Tenkan-sen (Conversion Line)
- Calculation:
(Highest High + Lowest Low) / 2over the last 9 periods. - Role: Acts as a minor support/resistance and a signal line. It reacts quickly to price changes. Steep angle = strong momentum.
2. Kijun-sen (Base Line)
- Calculation:
(Highest High + Lowest Low) / 2over the last 26 periods. - Role: The backbone of the system. It indicates medium-term momentum.
- Key Insight: Price tends to attract back to the Kijun-sen (rubber band effect) before resuming a trend.
3. Senkou Span A (Leading Span A)
- Calculation:
(Tenkan-sen + Kijun-sen) / 2plotted 26 periods ahead. - Role: Forms one boundary of the "Kumo" (Cloud).
4. Senkou Span B (Leading Span B)
- Calculation:
(Highest High + Lowest Low) / 2over the last 52 periods, plotted 26 periods ahead. - Role: The other boundary of the Kumo. Because it uses a longer period (52), it is a stronger support/resistance level. Flat sections of Span B are like brick walls for price.
5. Chikou Span (Lagging Span)
- Calculation: Current closing price plotted 26 periods behind.
- Role: The filter. It compares today's price action with the price 26 days ago. If Chikou is above the past price, the trend is bullish. If below, bearish.
2. Reading the Kumo (The Cloud)
The Cloud (space between Span A and B) is the most unique feature.
- Bullish Cloud: When Span A is above Span B (often colored Green).
- Bearish Cloud: When Span A is below Span B (often colored Red).
- Trend Confirmation:
- Price > Cloud = Uptrend.
- Price < Cloud = Downtrend.
- Price inside Cloud = No Trend (Chop/Noise). Do not trade.
- Support/Resistance: The cloud acts as a dynamic support zone in an uptrend and resistance in a downtrend. The thicker the cloud, the stronger the barrier.
3. The "TK Cross" Strategy
This is the most common signal, similar to a MACD crossover but with more context.
- Bullish TK Cross: Tenkan-sen crosses above the Kijun-sen.
- Strong Signal: Occurs above the Cloud.
- Neutral Signal: Occurs inside the Cloud.
- Weak Signal: Occurs below the Cloud (Counter-trend).
- Bearish TK Cross: Tenkan-sen crosses below the Kijun-sen.
- Strong Signal: Occurs below the Cloud.
- Neutral Signal: Occurs inside the Cloud.
- Weak Signal: Occurs above the Cloud.
Data Representation: Signal Strength Matrix
| TK Cross Type | Location Relative to Cloud | Signal Strength | Action |
|---|---|---|---|
| Bullish | Above Cloud | ⭐⭐⭐ (High) | Buy Aggressively |
| Bullish | Inside Cloud | ⭐⭐ (Medium) | Buy with Caution / Smaller Size |
| Bullish | Below Cloud | ⭐ (Low) | Scalp only / Wait |
| Bearish | Below Cloud | ⭐⭐⭐ (High) | Short Aggressively |
| Bearish | Inside Cloud | ⭐⭐ (Medium) | Kumo Breakout Pending |
| Bearish | Above Cloud | ⭐ (Low) | Potential Reversal Start |
4. The Kumo Twist
Since the Cloud is projected 26 periods into the future, we can look "forward" to see potential dates of trend reversals.
- Kumo Twist: When Span A crosses Span B in the future.
- Implication: This point represents a thin cloud, meaning weak support/resistance. Price often slices easily through the twist, making it a common target for trend reversals or breakouts.
5. The Kijun Bounce Strategy
This is a pullback strategy for trending markets.
- Identify Trend: Price is far above the Kumo and the Tenkan/Kijun lines.
- Wait for Pullback: Price drops down to touch the Kijun-sen (Base Line).
- Entry Trigger: Price tests the Kijun-sen but does not close below it. Enter long on the bounce.
- Stop Loss: A close below the Kijun-sen (or on the other side of the Cloud for wider stops).
6. Using the Chikou Span as a Filter
Many traders ignore the Chikou Span, but it often saves you from bad trades.
- Rule: NEVER take a long trade if the Chikou Span is below the price candles of 26 periods ago.
- Rule: NEVER take a short trade if the Chikou Span is above the price candles of 26 periods ago.
- Why? If Chikou is hitting price candles, it means the market is in traffic (consolidation). We want open air "blue skies" for the Chikou Span.
Conclusion
Ichimoku Kinko Hyo is a holistic system. It prevents you from trading against the trend (Cloud check), gives you entry signals (TK Cross), provides dynamic stop-loss levels (Kijun-sen), and filters out noise (Chikou Span).
While the chart may look messy at first, "one glance" eventually reveals the entire battlefield.
Disclaimer: Financial trading has large potential rewards, but also large potential risk.