The Wyckoff Market Cycle Theory: A Complete Masterclass
The Wyckoff Market Cycle Theory: A Complete Masterclass
The financial markets may seem chaotic, a sea of green and red candles flickering without rhyme or reason. But beneath the noise lies a structure, a rhythm orchestrated by the largest players in the game: institutions, hedge funds, and central banks. This structure was decoded over a century ago by a man named Richard D. Wyckoff.
The Wyckoff Method is not just a trading strategy; it is a complete philosophy of market mechanics. It posits that price action is fueled by the laws of Supply and Demand, Cause and Effect, and Effort versus Result. By understanding these laws, a retail trader can align themselves with the "Composite Man"—the smart money—rather than being swept away by the tide.
In this comprehensive guide, we will dissect the Wyckoff Market Cycle in granular detail. We will cover:
- The Three Fundamental Laws of Wyckoff
- The Composite Man Concept
- The Four Phases of the Market Cycle
- Detailed Schematics of Accumulation and Distribution
- Trading Strategies for Markup and Markdown
- Wyckoff 2.0: Modern Applications in Crypto and Forex
Part 1: The Three Fundamental Laws
Before diving into charts, one must internalize the logic that governs them. Wyckoff identified three laws that are immutable in free markets.
1. The Law of Supply and Demand
This is the heart of price movement.
- Demand > Supply: Price rises.
- Supply > Demand: Price falls.
- Supply = Demand: Price consolidates (equilibrium).
While simple in theory, Wyckoff traders learn to read the nuance of this relationship through volume analysis. A rising price on low volume indicates a lack of conviction (demand), suggesting a potential reversal.
2. The Law of Cause and Effect
In Wyckoff theory, a trend (Effect) cannot happen without a preparation phase (Cause).
- Accumulation represents the Cause for an uptrend (Effect).
- Distribution represents the Cause for a downtrend (Effect).
The "Cause" is measured by the time the market spends in a trading range. Typically, the longer the accumulation (Cause), the more explosive the subsequent markup (Effect). This is often quantified using Point and Figure (P&F) charts.
3. The Law of Effort vs. Result
This law signals a potential change in trend. "Effort" is seen in volume, while "Result" is seen in price action.
- Harmony: High volume (Effort) leads to a significant price move (Result). This confirms the trend.
- Divergence: High volume (Effort) leads to little or no price movement (Result). This suggests that large interests are unloading or absorbing shares, foreshadowing a reversal.
Part 2: The Composite Man
Wyckoff proposed a heuristic device to help traders understand price action: The Composite Man.
"…all the fluctuations in the market and in all the various stocks should be studied as if they were the result of one man’s operations. Let us call him the Composite Man, who, in theory, sits behind the scenes and manipulates the stocks to your disadvantage if you do not understand the game as he plays it; and to your great profit if you do understand it."
The Composite Man carefully plans, executes, and concludes his campaigns. He attracts the public to buy when he wants to sell, and terrifies the public into selling when he wants to buy.
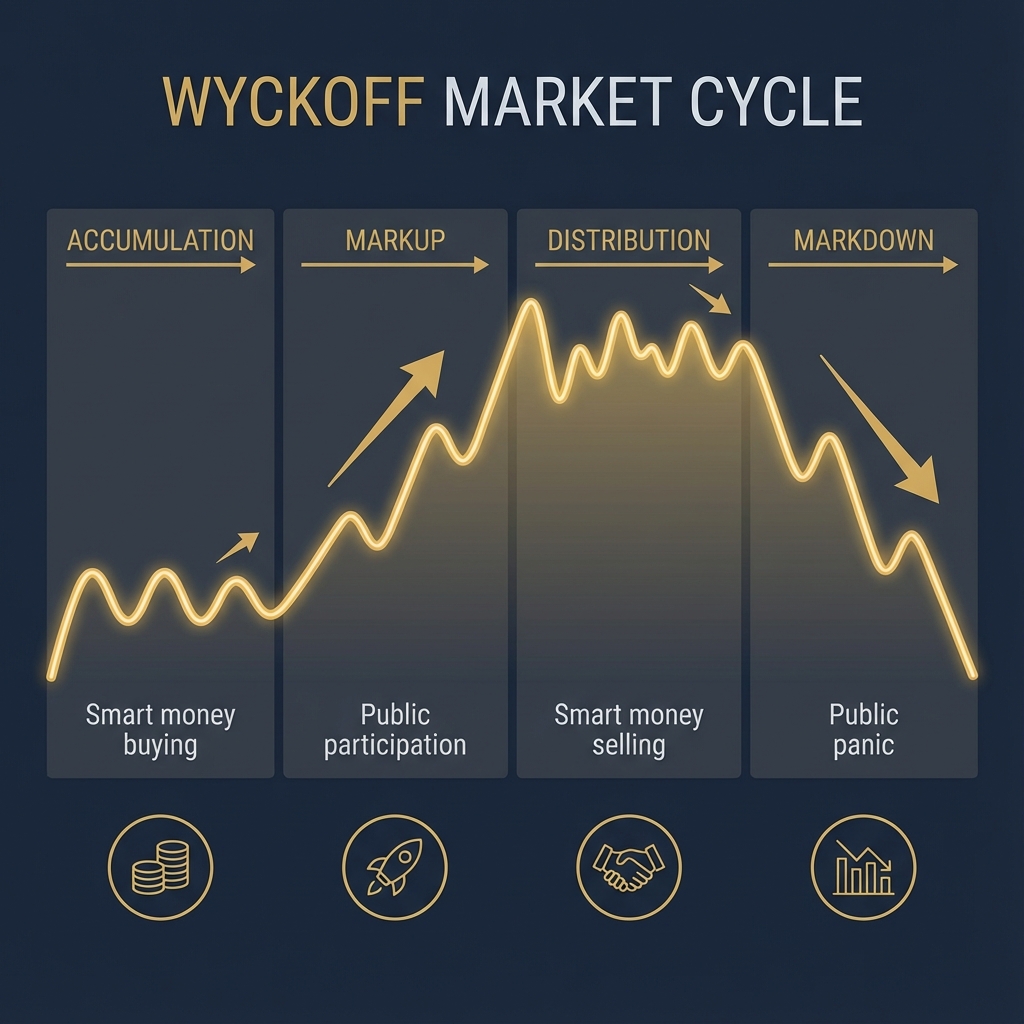
Part 3: The Four Phases of the Market Cycle
The market cyclically moves through four distinct phases. Identifying which phase the market is in is the single most important skill for a Wyckoff trader.
Phase 1: Accumulation
- Goal: Institutional buying.
- Context: Occurs after a downtrend. The Composite Man begins to absorb the selling pressure from retail traders who are panicked.
- Characteristics: Price moves sideways in a trading range (TR). Bad news fails to push the price lower.
- Outcome: Supply is removed from the market.
Phase 2: Markup (Uptrend)
- Goal: Price appreciation.
- Context: Supply is exhausted. The Composite Man marks up the price.
- Characteristics: Higher highs and higher lows. Strong breakouts on high volume, shallow pullbacks on low volume.
- Retail Action: This is where the public usually jumps in (often too late).
Phase 3: Distribution
- Goal: Institutional selling.
- Context: Occurs after an extended uptrend. The Composite Man sells his holdings to the "late majority" retail traders who are euphoric.
- Characteristics: Price moves sideways again. Good news fails to push the price significantly higher. Volatility increases.
- Outcome: The Composite Man empties his inventory.
Phase 4: Markdown (Downtrend)
- Goal: Price depreciation.
- Context: Demand is exhausted. The Composite Man may short the market.
- Characteristics: Lower highs and lower lows. Sharp drops on high volume.
- Retail Action: Panic selling (capitulation), which feeds the next Accumulation phase.
Part 4: Anatomy of Accumulation
The Accumulation Trading Range is not just a box; it's a sequence of events. Wyckoff labeled these events A through E.
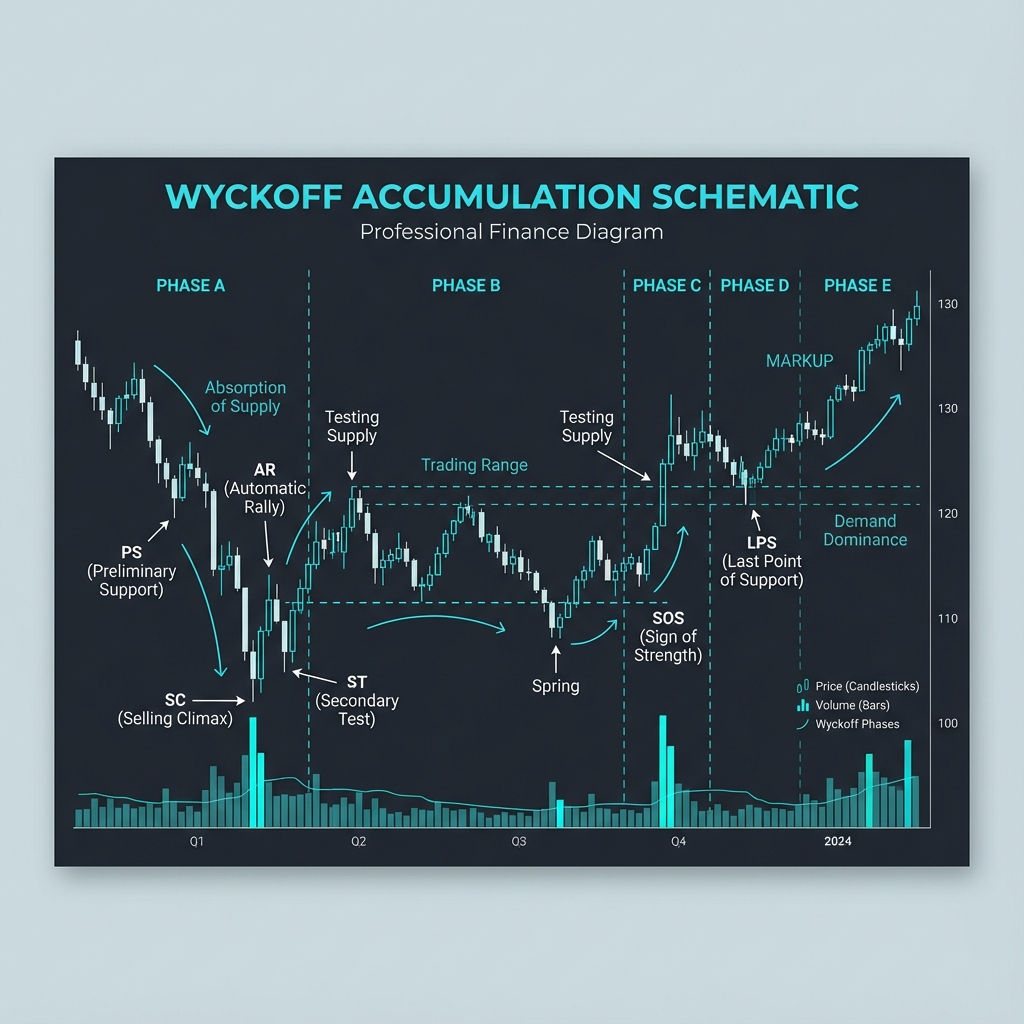
Phase A: Stopping the Prior Trend
The downward momentum must be arrested.
- PS (Preliminary Support): Significant buying begins to provide support. Volume increases.
- SC (Selling Climax): The point of panic selling. Wide price spreads and extremely high volume. The hands of the weak transfer to the strong.
- AR (Automatic Rally): Selling pressure evaporates, causing price to pop up easily.
- ST (Secondary Test): Price revisits the SC area to test if supply is still present. Volume should be lower than at the SC.
Phase B: Building the Cause
This is the longest phase where the Composite Man quietly accumulates.
- UA (Upthrust Action): False breakouts to the upside.
- ST in Phase B: Continued testing of support levels.
Phase C: The Spring (The Bear Trap)
This is the decisive moment.
- Spring: A price move below the support level established by the SC. It is a "shakeout" designed to mislead traders into thinking the downtrend is resuming.
- Three Types of Springs:
- No. 1: High volume breakdown (failed spring, danger).
- No. 2: Moderate volume (requires a secondary test).
- No. 3: Low volume (high probability buy signal).
Phase D: The Change of Character (ChoCH)
Price starts to climb within the range.
- SOS (Sign of Strength): Price rallies on high volume and wider spreads.
- LPS (Last Point of Support): Pullbacks on low volume that hold a higher low. This is the ideal entry point.
Phase E: The Breakout
Price leaves the trading range. The Markup phase begins.
Part 5: Anatomy of Distribution
Distribution is the inverse of Accumulation, but often more volatile and faster because fear (selling) is a stronger emotion than greed.
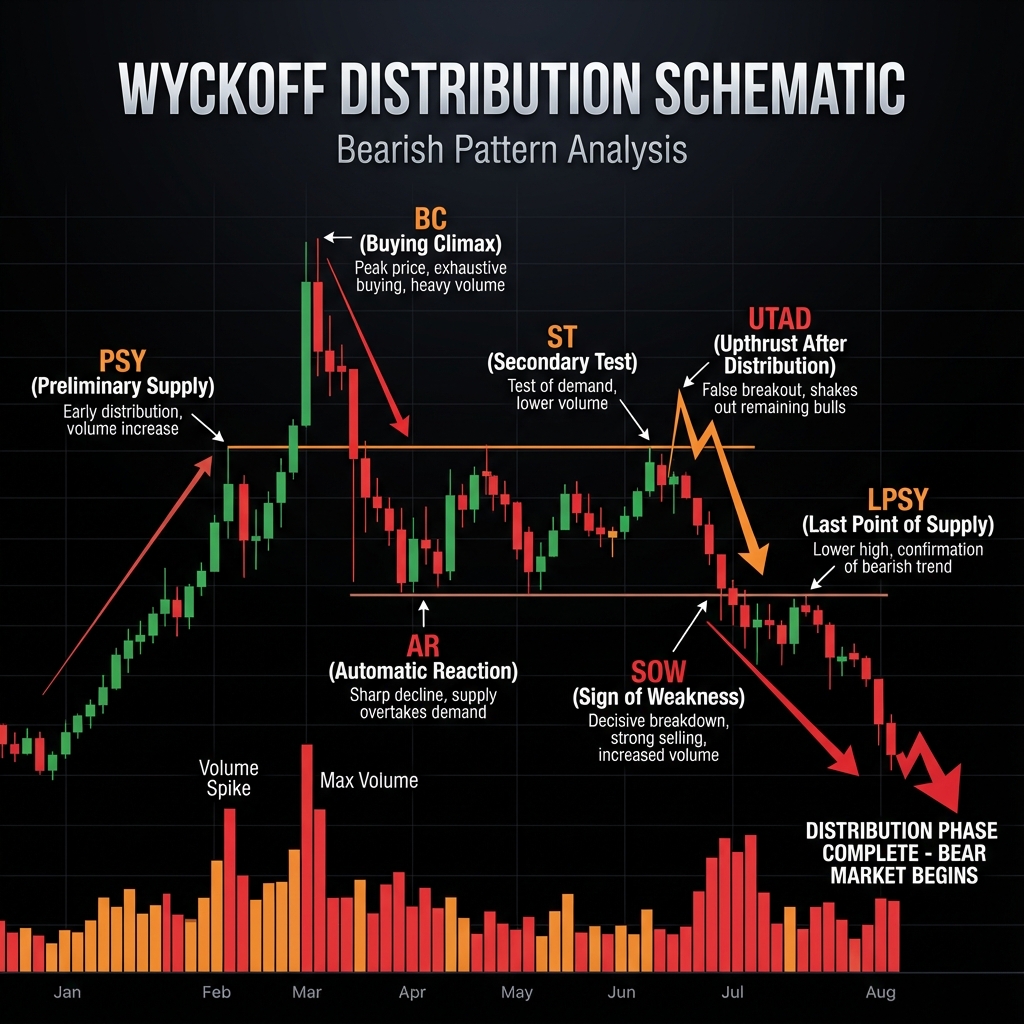
Phase A: Stopping the Uptrend
- PSY (Preliminary Supply): Institutional selling begins.
- BC (Buying Climax): The peak of euphoria. Huge volume and spread.
- AR (Automatic Reaction): A sharp sell-off as demand vanishes.
- ST (Secondary Test): Price tries to revisit the BC highs.
Phase B: Building the Cause
Volatility remains high.
- UT (Upthrust): Brief moves above resistance to trap breakout buyers.
Phase C: The UTAD (Upthrust After Distribution)
The "Bull Trap."
- UTAD: A counterpart to the Spring. Price breaks out to a new high, inducing FOMO, only to reverse sharply and close back inside the range. This confirms that the smart money is effectively short.
Phase D: The Slide
Price begins to fall within the range.
- LPSY (Last Point of Supply): Rallies are weak and fail to reach previous highs. These are the ideal short entries.
Phase E: The Breakdown
Price breaks the support line (Ice). The Markdown phase begins.
Part 6: Data Representation: Volume Signatures
To trade Wyckoff, you must verify price with volume. Here is a cheat sheet:
| Event | Desired Price Action | Desired Volume Action | Implication |
|---|---|---|---|
| Selling Climax (SC) | Wide spread down, close off lows | Ultra High | Transfer of hands (Panic -> Smart Money) |
| Secondary Test (ST) | Approaches SC Low | Low (Lower than SC) | Supply is drying up; Valid bottoming |
| Spring | Breaks below Support | Very Low | No supply below the market; Bullish |
| Sign of Strength (SOS) | Strong rally not seen before | Increasing / High | Demand is taking control |
| Buying Climax (BC) | Wide spread up, stalling | Ultra High | Smart money selling into strength |
| Upthrust (UT) | Breakout above Resistance | Low or High (Reversal) | Trap for bulls |
Part 7: Step-by-Step Wyckoff Trading Strategy
Step 1: Market Context
Zoom out. Is the market in a multi-year uptrend or downtrend? A Wyckoff setup has higher success probability if it aligns with the macro trend or signals a major reversal of it.
Step 2: Identify the Phase
Draw your support (Creek) and resistance (Ice) lines.
- Are we making higher highs (Markup)?
- Are we ranging (Accumulation/Distribution)?
Step 3: Wait for Phase C
Do not guess the bottom. Wait for the Spring (in Accumulation) or the UTAD (in Distribution). These provide a defined risk level.
- Stop Loss: Just below the low of the Spring.
Step 4: Enter on Phase D confirmation
The safest entry is not the Spring itself, but the LPS (Last Point of Support). This is the first higher low after the Spring.
- Entry: On the reversal of the LPS candle.
- Confirmation: Volume should contract on the pullback to the LPS.
Step 5: Profit Taking
- First Target: The top of the Trading Range (Resistance).
- Second Target: Measured move based on the P&F count or a 1:3 risk-reward ratio into the Markup phase.
Conclusion
The Wyckoff Method requires patience. It is not a system of flashing arrows but a discipline of observation. By learning to see the market through the eyes of the Composite Man, you stop being the "liquidity" for institutional moves and start riding the waves they create.
For the serious trader, mastering Wyckoff is arguably the most valuable investment of time one can make. It works on 1-minute timeframes for scalpers and monthly timeframes for investors. The laws of Supply and Demand do not change.
Disclaimer: This article is for educational purposes only. Trading involves risk.